Help
Workflow Debugging
Help menu
- Help content
- AS2
- Examples and Tutorials
- IO Queues and Forms
- Maps
- Schemas
- Send and Receive Ports
- Send and Receive Ports / Transports
- Servers
- Static Configuration
- Tracking
- Workflows
- Workflows / Workflow Activities
- Call Web Service Direct Activity
- Compensatable Sequence Activity
- Compensatable Transaction Scope Activity
- Compensate Activity
- Conditioned Activity Group
- Database Activity
- Delay Activity
- Event Handling Scope Activity
- Event Driven Activity
- Expression Activity
- Fault Handler Activity
- If Else Activity
- Increment Activity
- Invoke Web Service Activity
- Invoke Blue Integrator Workflow Activity
- Invoke Workflow Activity
- Listen Activity
- Map Activity
- Parallel Activity
- Policy Activity
- Send Receive Port Response Activity
- Replicator Activity
- Send Receive Port Response Activity
- Send Port Message Activity
- Sequence Activity
- Suspend Activity
- Synchronization Scope Activity
- Transaction Scope Activity
- While Activity
Blue Integrator provides numerous means of debugging errant Workflows.
(1) New Instance Debugging. You can simply use the Debug | Start menu item in Visual Studio for Applications to kick off a new Workflow Instance and attach the debugger to it. Note that this won’t use the latest VSTA code but the saved version of the Workflow itself. You’ll be prompted to specify file locations for all incoming and outgoing Messages. This is normally the best way of testing your Workflow prior to deployment. When running in this mode you can use both VS.Net trace functionality, and even good old System.Windows.Forms.MessageBox. You cannot of course use MessageBox in a live Workflow Instance.
(2) Isolation. Always try and get the cleanest possible scenario for debugging. Stop all non-essential Workflow Instances and processes to minimize the noise whilst you are trying to rack down your problem.
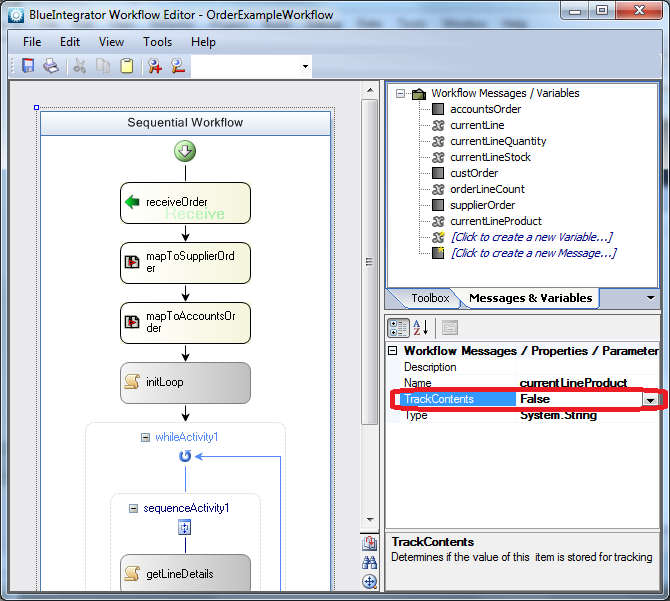
(3) Tracking. You can get a lot of information by enabling the various Tracking options on the Workflow Binding, and then using Blue Integrator Tracking to view this information. Note that to track Messages and Variables, the relevant Tracking option needs to be selected both on the Binding and on the Message / Variable itself (as shown below).
(4) Tracing. Tracing is generally easier than debugging. Write out all the information you can from within your Workflow, either using ThisWorkflow base method Log, or a proprietary tracing solution (e.g. a file). VS.Net trace functionality will not work with a running Workflow unless you are attached to a debugger. Base method Log logs to the Windows event log and to the Blue Integrator tracking log.
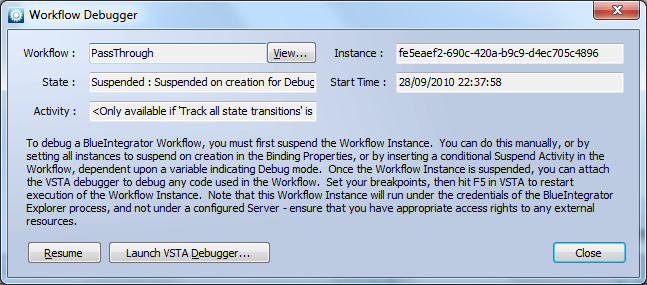
(5) Workflow Instance Debugging. You can watch the live state of a Workflow and attach Visual Studio for Applications using the Debug button on the Workflow Instance views. We recommend always enabling the Track all State Transitions option on the Binding before proceeding down this route.